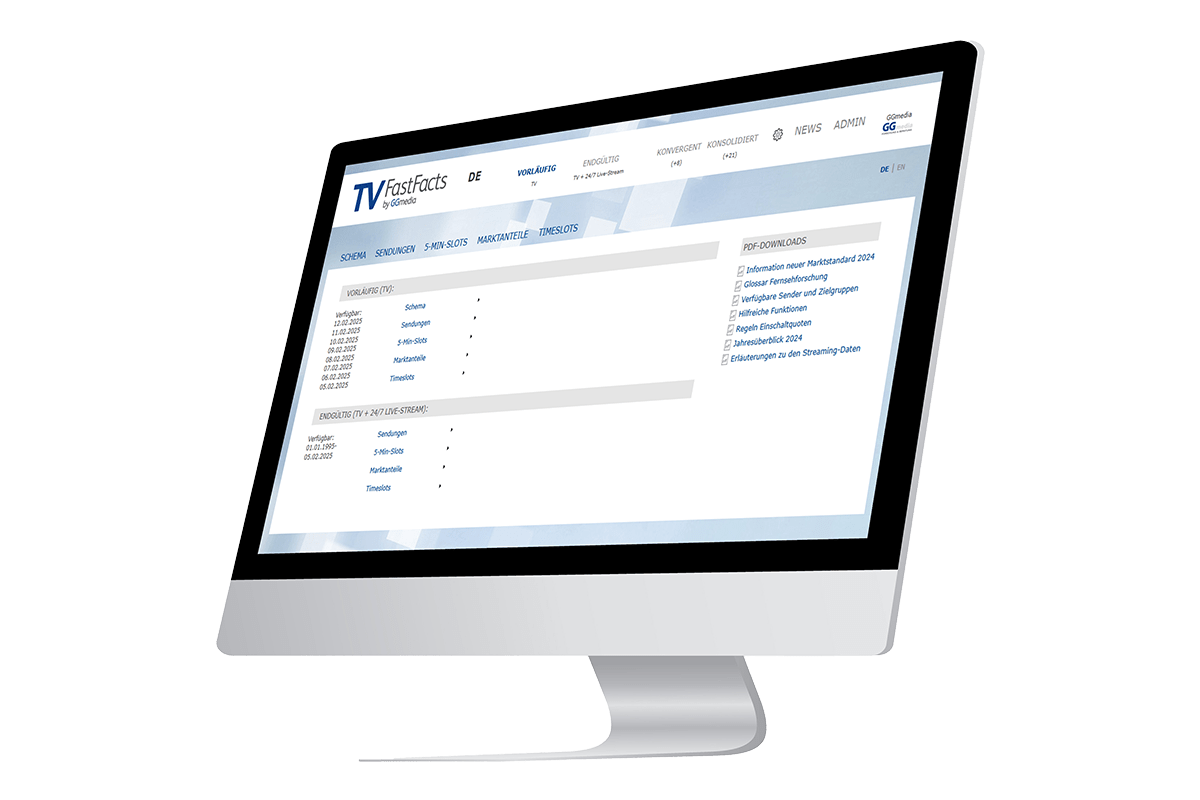
TVFastFacts by GGmedia
TVFastFacts combines getting information quickly from TV data from the previous day with the functions of a database for long-term evaluations. We calculate daily data from the GfK Fernsehforschung and upload it into the software before 9 a.m. – 365 days a year. Our customers can put together their own individual data package and access the data anytime and anywhere. Preliminary and final weighted data as well as streaming data are available in seconds and can be printed or downloaded. All data subscriptions can be cancelled or adjusted on a monthly basis – with no minimum term.
Extensive Database
Preliminary Weighted Data
The preliminary weighted data (“overnights”) is available the day after broadcast and provides a quick daily overview.
Final Weighted Data
The final weighted data is available 8 days after broadcast and also includes time-shifted and live stream usage of the corresponding programs.
Streaming Data
Streaming data is based on the final weighted data and is additionally enriched with the online usage of the programs on demand (video on demand).
Our Reference Clients from All Over the World
TV Data
TVFastFacts provides various types of TV data from the AGF/GfK Videoforschung, as well as different ways to display it (graphically). Based on our own research, we enrich the AGF data by adding the production companies involved in all TV formats.
Preliminary TV Data
Program Data
incl. audience shares, market shares, program-related averages; production companies
Final Weighted TV Data
Program Data
incl. audience shares, market shares, program-related averages; production companies
Market Shares
Broadcaster-related: daily, monthly, or annual intervals.
Market Shares
Broadcaster-related: daily, monthly, or annual intervals.
Timeslots
Freely selectable time intervals within a day: channel-related audience shares and market shares
Timeslots
Freely selectable time intervals within a day: channel-related audience shares and market shares
Time Intervals
Graphical representation of the 5-minute intervals
Time Intervals
Graphical representation of the 5-minute intervals
Schematic Diagrams
Overview of the broadcast day in the style of a TV guide, including audience and market shares
Streaming Data
Program Data
Preliminary and final weighted: incl. audience shares, market shares, net reach; production companies
TV Channels
Target Groups
Programs
Years

TV Broadcasters Can Import Their Own Data
We grant TV broadcasters access to our tool for importing their own TV data. This allows you to present your own data clearly and make it accessible to your employees.
- Your data - our analytical algorithms
- Only visible for your company
- Quick evaluations without effort